Is Europe catching up on competitiveness?
746 days after the Draghi Report, Momentum Tracker EU shows whether Europe is turning ambition into progress, or falling further behind.
We track competitiveness through three main pillars: technological autonomy, creative destruction, and geopolitical strength. Each pillar consists of several transparent indicators, which together aggregate into the Momentum Index.
Explore the Index below, or dive deeper into each indicator on our site.
Who is gaining momentum?
Compare every European country against the global benchmark and discover where competitiveness is strengthening, stagnating, or falling behind.
Countries tinted by their Momentum Index country score. The United States is the benchmark at 100; China is scored as a bloc on the full index.
European Union
| Metric | Latest | Score |
|---|---|---|
| Patent filings per million | 103(2024) | 64 |
| High-tech exports share | 20.6% | 85 |
| Unicorns per million | 0.26(2025) | 12 |
| GDP per capita | $35,365 | 52 |
| Output per worker | $119,168 | 76 |
Scored on the 5 of 12 index metrics that exist for every country, so this figure can be compared with a country's. On the full 12 metrics the EU scores 54, which is the headline index: it counts capacity the country view cannot see, such as AI compute and the value of the largest companies.
The burning platform
Europe is not short of ideas, talent or capital. It is short of time. Since 2008 the gap in output per person between Europe and the United States has widened year after year, and China has closed two decades of distance in one. Every quarter of drift makes the next reform more expensive: the companies that leave do not come back, the capital that scales them compounds elsewhere, and the technologies that define the next economy get built on someone else's terms.
The Draghi report said it without varnish: Europe must change how it invests, regulates and scales, or accept managed decline. Momentumtracker EU exists to keep that sentence from being forgotten. We track the numbers that reveal whether Europe is actually turning, in real time, in public, against the two competitors that set the pace.
Europe's innovation crisis
The cost of falling behind in the global innovation race.
All figures are real. Market value and AI models are live; economic figures show their latest published year, since official statistics lag by one to three years. Click a chart icon to see the full trend.
America owns the companies that matter.
The combined market value of each region's eight most valuable listed companies, in any sector. Europe's champions are real, but the value created by the last technology cycle accrued almost entirely to American firms.
See all 32 indicatorsSource: Tradegate live prices · ECB FX · company filings
Europe still invents. It stopped growing.
An international patent filing is what a company does when it means to protect an invention beyond its own border. China filed more of them in 2024 than any country in the world, up from almost nothing in 2000, while Europe has filed roughly the same number every year since 2010. Per head Europe still files more than China, and that reading is one click away on the chart, but it is the volume that meets European companies in world markets.
See the full seriesSource: WIPO PCT filings via the OECD · World Bank population · 2024 · in total: US 55,218, EU 46,278, China 67,773
How Europe closes the competitiveness gap
Explore the reforms, insights and policy choices that can strengthen Europe's competitiveness, supported by the evidence of data.

Close the innovation gap
Europe is caught in a middle-technology trap: strong in mature industries, but weak at the frontier of AI, cloud and semiconductors, where the US and China are pulling ahead.


Mobilise investment at scale
Draghi puts the additional investment Europe needs at roughly €750 to €800 billion per year, a scale comparable to the post-war reconstruction effort relative to GDP.

Lower industrial energy costs
European firms pay far more for electricity and gas than their US competitors, which steadily erodes the competitiveness of energy-intensive industry.
Latest from the S9+ Coalition
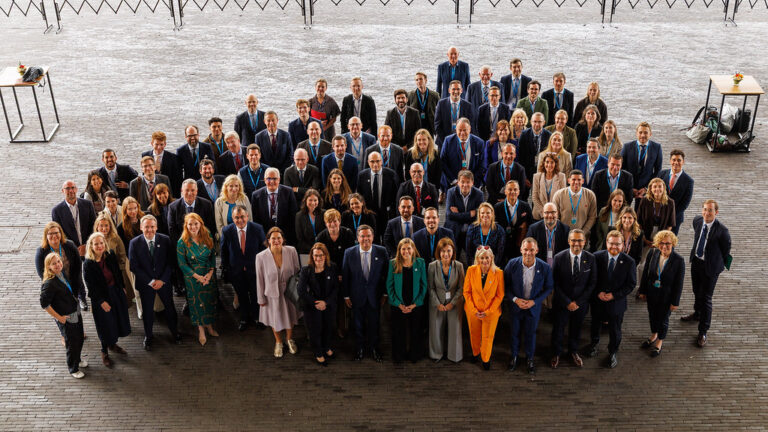
S9+ Brings Startup Voice to the D9+ Ministerial Meeting in Luxembourg
Luxembourg, June 2026 – The S9+ Coalition participated in the D9+ Ministerial Meeting hosted under the Luxembourg Presidency, bringing together ministers, government representativ…
Read article
S9+ Luxembourg Declaration: Europe Needs Speed, Not Small Steps
Europe’s startup ecosystems are calling for a fundamental shift in the EU’s competitiveness agenda, warning that fragmentation, regulatory complexity, and a widening capital gap a…
Read article
Scale Ireland Joins S9+: Strengthening the Voice of Irish Innovation in Europe
We are thrilled to welcome Scale Ireland as our newest associated member, bringing the voice of Irish tech founders to the forefront of the D9+ policy conversation. The S9+ is cov…
Read article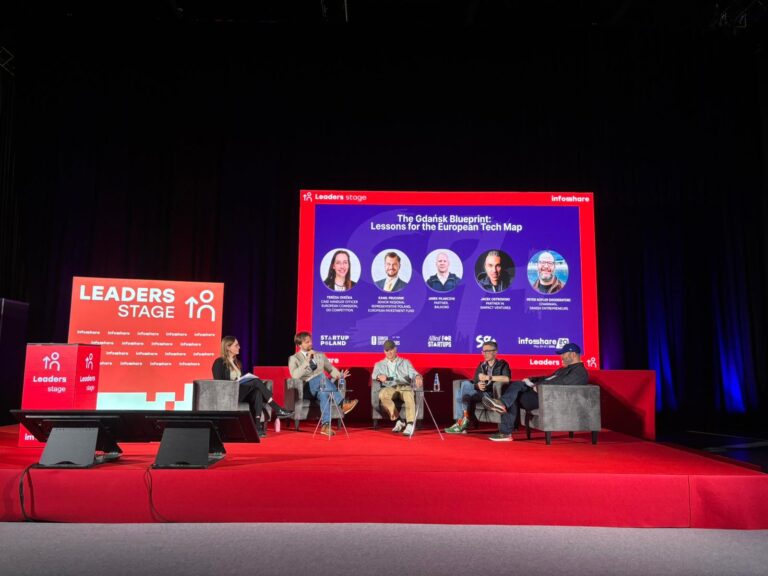
S9+ headed to Infoshare in Gdansk
The historic city of Gdańsk served as the backdrop for this year’s Infoshare, where the S9+ Coalition hosted two high-stakes panel debates.
Read articleWe would like to measure how the site is used. Analytics cookies tell us which pages and charts people read, nothing more. They are optional, and the site works exactly the same either way. Details in our cookie policy and privacy policy.